We conducted highly complex tests on website speed based on many scenarios and aspects. It is a huge website speed research on different e-commerce platforms and millions of online store websites by analyzing their site performance with different speed factors & purposes.
Here is step-by-step process:
- We scrapped millions of websites
- Executed bulk speed tests with many factors and extracted all the data systematically.
- Then categorized eCommerce & non eCommerce
- Then again Categorized it based on which platform they are built on such as Shopify, Wix Stores, BigCommerce, Squarespace, Weebly eCwid, and other 30+ different eCommerce platforms and website builders.
- Then we took the average of all the data.
- Finally, we got the fastest-loading eCommerce platform/website builder with different scenarios and purposes.
We collected various metrics related to website speed such as server response time, locations, devices, data impacting speed metrics, first-byte time, server distance latency, optimization level, CDN usage, Gzipping, caching, cloud hosting, lazy load impact, contentful speed time, mobile speed, total size vs speed, overall speed index, etc.
Who Is The Winner?
Shopify? Wix Stores? BigCommerce? or
Something New?
Total websites we tested = 1 Million+ (randomly, varying conditions such as high traffic to low traffic, page sizes, etc to normalize the variations in particular conditions. We also conducted separate tests with different conditions to observe the variations. we aimed to test all possible options.
Key Findings:
- Shopify – Overall has an average performance on all metrics
- Wix – Overall well-optimized speeds on all devices
- Squarespace – Fastest to interact on both desktop and mobile
- Weebly – Weebly websites become interactive as soon as the content appears on the browser, but not the fastest load.
- BigCommerce – It has bulky websites and takes more time to become interactive
- Ecwid – Its server response is the slowest among the website builders, but the fastest in total load time. Because its sites have fewer scripts (& fewer functionalities)
We did not include WooCommerce in our testing because it can be hosted anywhere, and its speed depends on the quality of the hosted server making it impossible to accurately measure the speed.
Let’s see in detail one by one:
Shopify
In our total scraped eCommerce website list, 300k+ were Shopify websites. (Shopify has 3.8 Million live websites, We randomly extracted 300k websites from top to bottom, with varying high traffic levels, and page sizes)
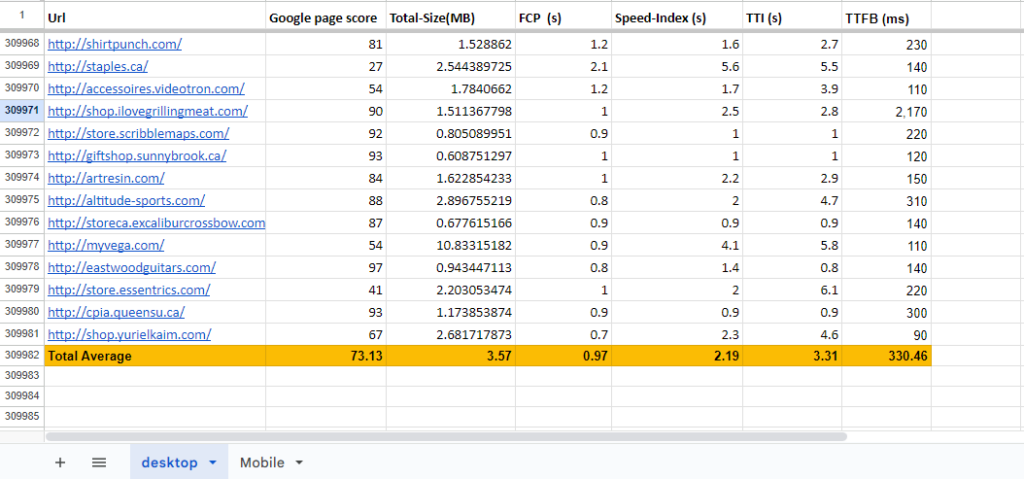
Desktop
- Google Page Score (Higher is better)= 73.13
- Average Page Size = 3.57 MB
- TTFB (Lower is better)= 330.46 ms
- FCP = 0.97 s
- Speed Index = 2.19 s
- TTI = 3.31 s
Mobile
- Google Page Score (Higher is better)= 35.54
- Average Page Size = 3.30 MB
- TTFB (Lower is better)= 420 ms
- FCP = 3.68 s
- Speed Index = 8.55 s
- TTI = 17.44 s
Wix eCommerce
We tested 240k+ Websites (out of 1.7 million live Wix Stores)
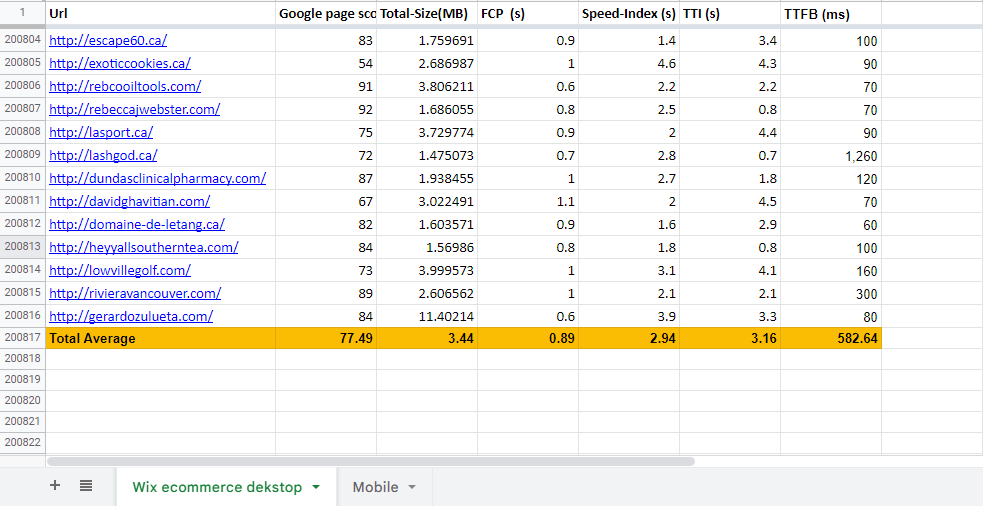
Desktop
- Google Page Score (Higher is better)= 77.49
- Average Page Size = 3.44 MB
- TTFB (Lower is better)= 582.64 ms
- FCP = 0.89 s
- Speed Index = 2.94 s
- TTI = 3.16 s
Mobile
- Google Page Score (Higher is better)= 32.5
- Average Page Size = 2.9 MB
- TTFB (Lower is better)= 711.6 ms
- FCP = 3.4 s
- Speed Index = 10.2 s
- TTI = 14.8 s
Squarespace Commerce
We tested 140k+ websites (Out of 400k+ Squarespace Business & eCommerce live websites)
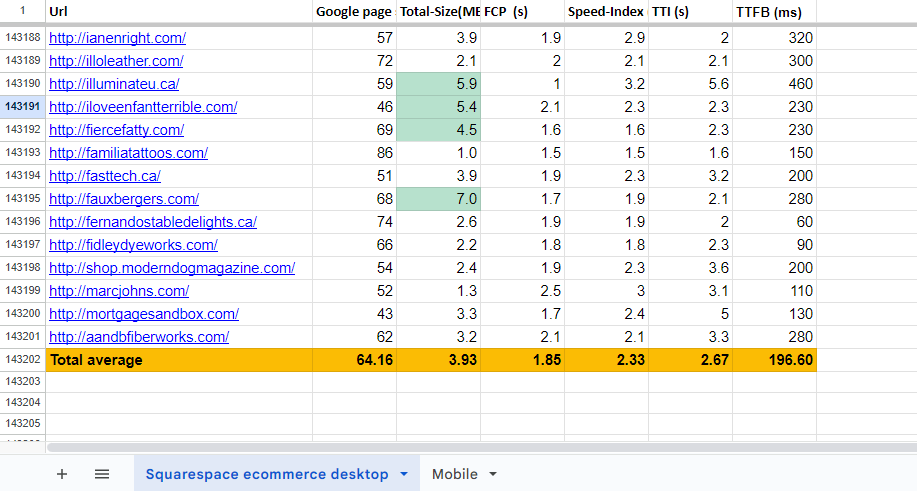
Desktop
- Google Page Score (Higher is better)= 64.16
- Average Page Size = 3.93 MB
- TTFB (Lower is better)= 196.60 ms
- FCP = 1.85 s
- Speed Index = 2.33
- TTI = 2.67 s
Mobile
- Google Page Score (Higher is better)= 34.89
- Average Page Size = 4.84 MB
- TTFB (Lower is better)= 235.5 ms
- FCP = 6.92 s
- Speed Index = 7.86 s
- TTI = 10.96 s
Weebly
We tested 95k+ websites
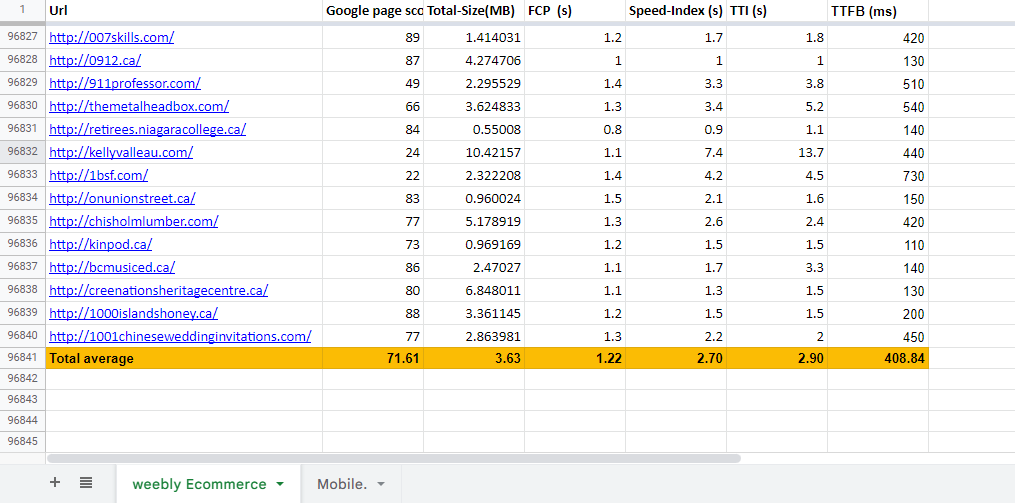
Desktop
- Google Page Score (Higher is better)= 71.61
- Average Page Size = 3.63 MB
- TTFB (Lower is better)= 408.84 ms
- FCP = 1.22 s
- Speed Index = 2.70 s
- TTI = 2.90 s
Mobile
- Google Page Score (Higher is better)= 32.39
- Average Page Size = 3.34 MB
- TTFB (Lower is better)= 607.68 ms
- FCP = 5.26 s
- Speed Index = 9.42 s
- TTI = 14.99 s
BigCommerce
We tested 40k+ websites
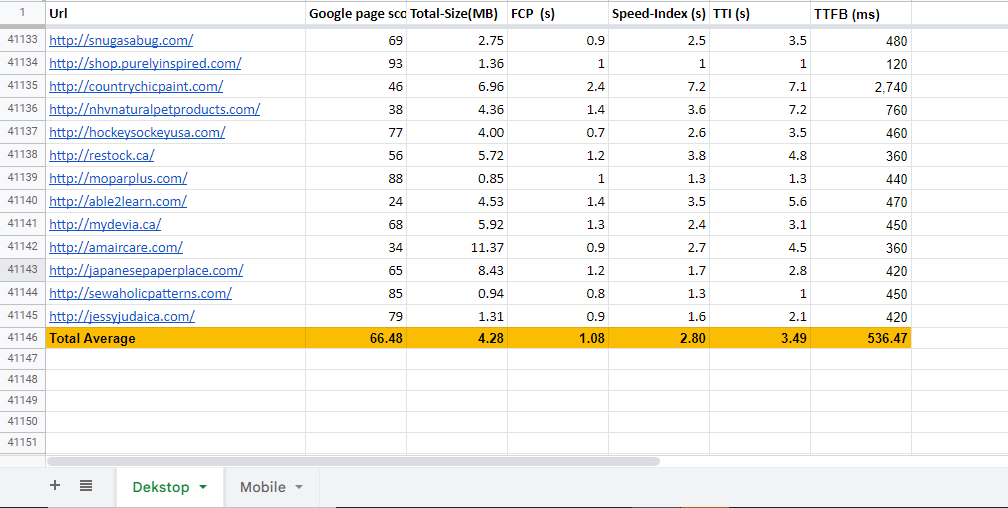
Desktop
- Google Page Score (Higher is better)= 66.48
- Average Page Size = 4.28 MB
- TTFB (Lower is better)= 536.47 ms
- FCP = 1.08 s
- Speed Index = 2.80 s
- TTI = 3.49 s
Mobile
- Google Page Score (Higher is better)= 28.67
- Average Page Size = 3.86 MB
- TTFB (Lower is better)= 601.96 ms
- FCP = 4.10 s
- Speed Index = 10.40 s
- TTI = 17.58 s
Ecwid Instant Sites
We tested 20k+ websites
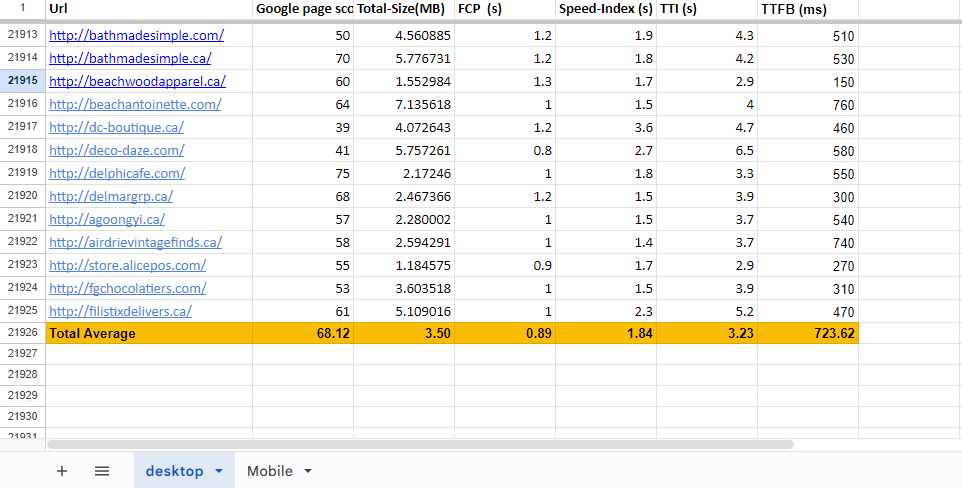
Desktop
- Google Page Score (Higher is better)= 68.12
- Average Page Size = 3.50 MB
- TTFB (Lower is better)= 723.62 ms
- FCP = 0.89 s
- Speed Index = 1.84 s
- TTI = 3.23 s
Mobile
- Google Page Score (Higher is better)= 37.73
- Average Page Size = 5.53 MB
- TTFB (Lower is better)= 730.6 ms
- FCP = 3.19 s
- Speed Index = 6.69 s
- TTI = 16.20 s
Other 30 eCommerce platforms = 200k+ websites
Speed Comparison of Top eCommerce Platforms
| Desktop | Mobile | |||||||||||
|---|---|---|---|---|---|---|---|---|---|---|---|---|
| Google Page Score | Average Page Size (MB) | TTFB (ms) | FCP (s) | Speed Index (s) | TTI (s) | Google Page Score | Average page size (MB) | TTFB (ms) | FCP (s) | Speed Index (s) | TTI (s) | |
| Shopify | 73.13 | 3.57 | 330.46 | 0.97 | 2.19 | 3.31 | 35.54 | 3.3 | 420 | 3.68 | 8.55 | 17.44 |
| Wix Store | 77.49 | 3.44 | 582.64 | 0.89 | 2.94 | 3.16 | 32.5 | 2.9 | 711.6 | 3.4 | 10.2 | 14.8 |
| Squarepace | 64.16 | 3.93 | 196.6 | 1.85 | 2.23 | 2.67 | 34.89 | 4.84 | 235.5 | 6.92 | 7.86 | 10.96 |
| Weebly | 71.61 | 3.63 | 408.84 | 1.22 | 2.7 | 2.9 | 32.39 | 3.34 | 607.68 | 5.26 | 9.42 | 14.99 |
| BigCommerce | 66.48 | 4.28 | 536.47 | 1.08 | 2.8 | 3.49 | 28.67 | 3.86 | 601.96 | 4.1 | 10.4 | 17.58 |
| Ecwid | 68.12 | 3.5 | 732.62 | 0.89 | 1.84 | 3.23 | 37.73 | 5.53 | 730.6 | 3.19 | 6.69 | 16.2 |
After analyzing the data, we discovered key insights on website speed for different platforms. There is no perfect eCommerce builder, Some perform well on desktops, while some don’t. Some are fast to display whereas some are fast to interact. It depends on your goal or which thing you care about the most in your online store.
We have explained below some of the speed metrics in detail, including TTFB, FCP, Speed index, TTI, and their impact on the speed.
#1. TTFB – Time To First Byte
The time to the first byte is the time span between the moment a server receives a request and the moment it sends the first byte of information back to the browser.
Let’s take an example to simplify this concept. Imagine that you are searching for a website websitebuilderly.com on your browser. The browser basically sends a request to the server where websitebuilderly.com is hosted. The server will then look for the request and try to fetch information associated with websitebuilderly.com from its hosting database or cache. It will load all the necessary files of the websites and provides the response to the browser.
TTFB = Request time+ Processing time+ Time to take the first byte to load /respond on the browser
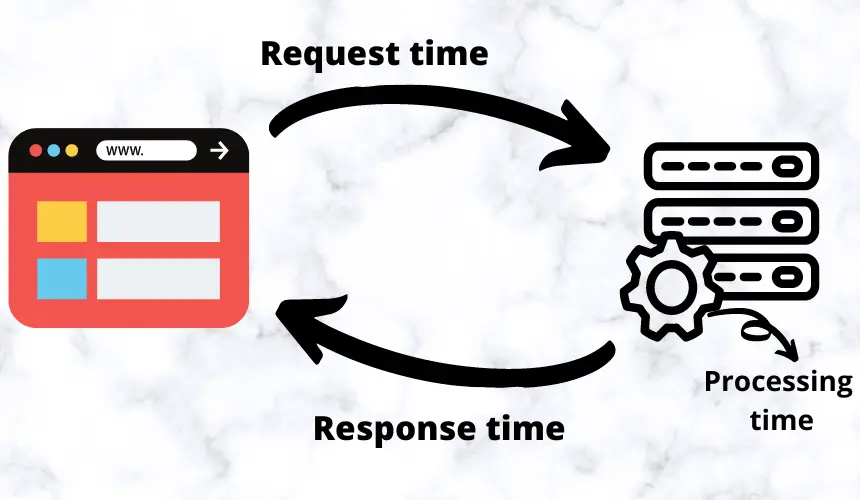
Request and Response times can vary based on location. If the server location is far from the user’s location, it takes more time to send requests & receive responses from the server. Processing time is one of the key parameters for achieving better TTFB. It indicates a fast and reliable server. Website builders with good processing times can deliver content more quickly.
For example, the Shopify server is located in Ottawa, Ontario, Canada. On top of the hosting, Shopify enabled the Cloudflare cache or CDN in 100+ locations all over the world. But still, original server location matters especially for eCommerce. We tested Shopify customer websites for TTFB in 35 countries.
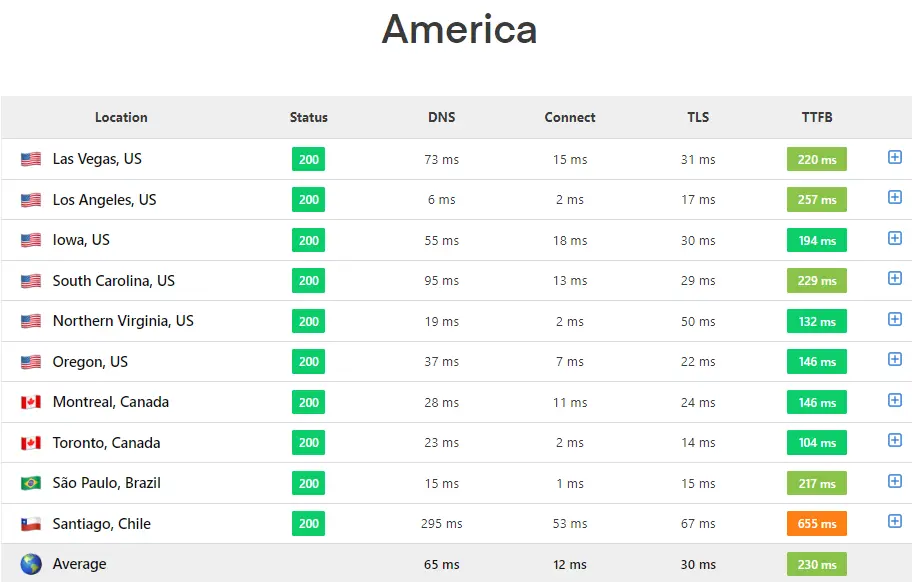
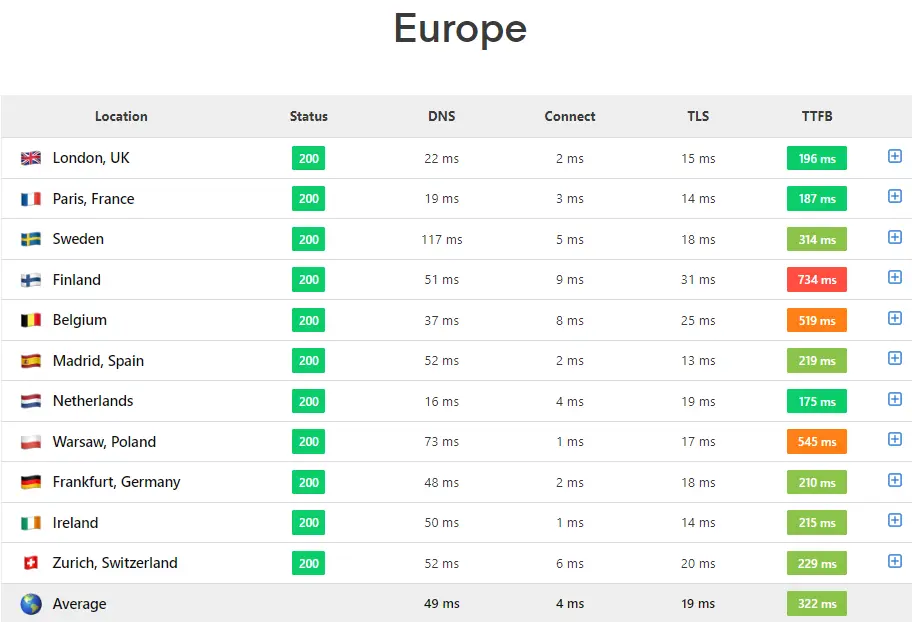
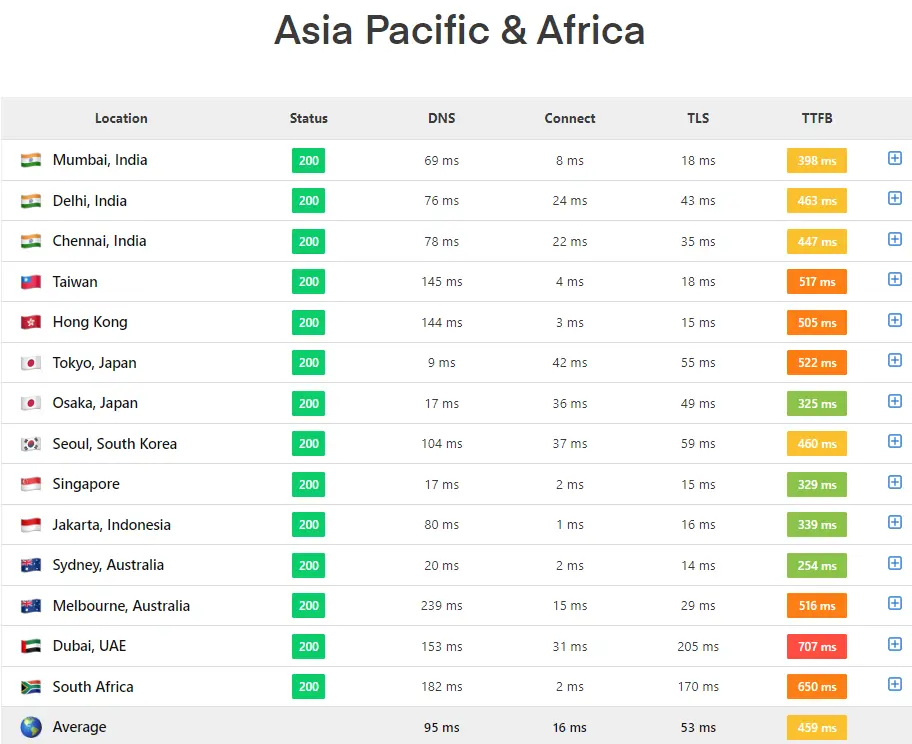
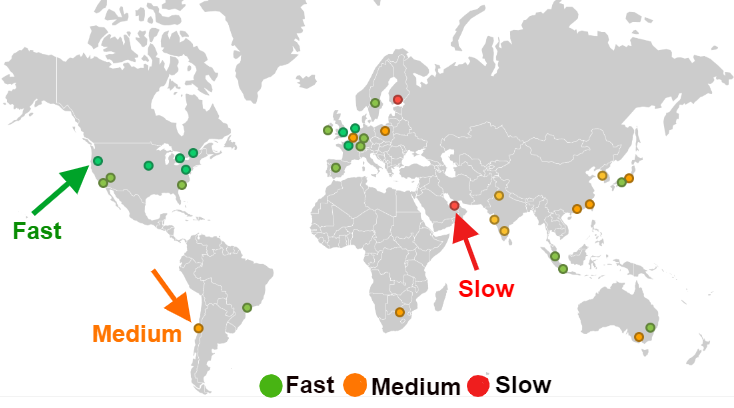
The screenshots above show the time to the first byte from various countries. We found that server response is fast from US & Canada, and it keeps declining for Europe, Asia, and Pacific countries.
The Shopify website’s TTFB is 2X – 3X faster in Canada than in other locations
It is slower TTFB for the locations that are far from Ottawa, Canada. For example, Japan, Australia, Korea etc. You can see the chart above where TTFB is only 104ms in Toronto while in Asian countries TTFBs are 400+ms. However, there is will a lot of fluctuations even though it is tested in isolated conditions, But we can see clearly the overall average speed will be much faster in the nearer locations of the server. (This is a flat map, even in the 3D globe map, Asia is far from Canada in any direction)
Key Points
- The lesser the TTFB, the faster and more powerful the hosting server is.
- From our tests, we found that Squarespace eCommerce websites provide faster server responses.
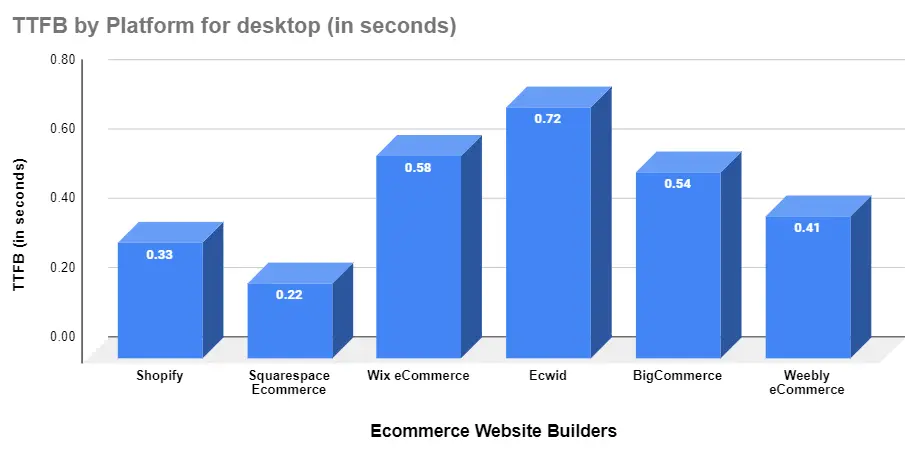
- All platforms TTFB for desktop devices is faster than that of mobile devices.
- Ecwid’s website takes more time to display the first byte from the server.
TTFB: Desktop vs Mobile
Desktop:
Mobile:
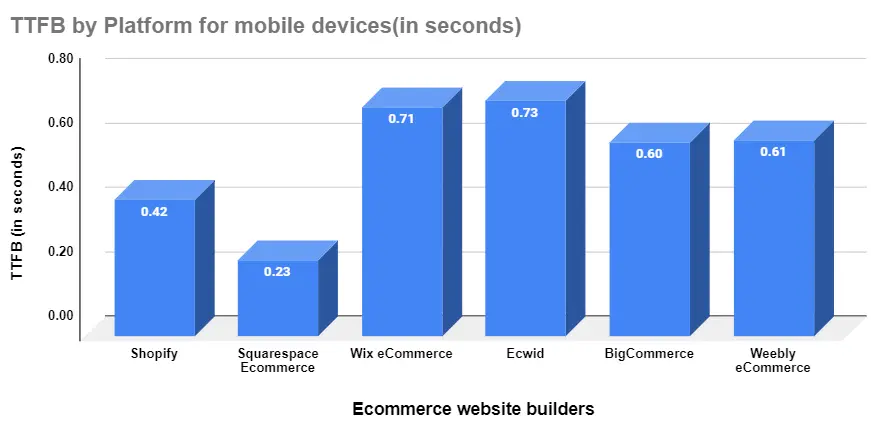
Key Points
- Squarespace eCommerce websites provide faster server responses.
- TTFB for desktop devices is faster than for mobile devices.
- Ecwid’s website takes more time to display the first byte from the server even though the websites are very simple.
- lesser the TTFB indicates the faster and more powerful hosting server
#2. FCP – First Contentful Paint
The first contentful time(FCP) is the time taken to render the first visual block of text or image on the browser. This content is the first thing a user perceives as soon as they navigate to a website. A fast FCP provides a good indication to the customer about the website’s loading speed and makes users wait for the rest of the content. If the browser takes more time to load the initial text block or images, the user may exit the website, leading to higher bounce rates that can negatively affect the business as well as SEO.
As soon as the first byte of the information is displayed on the screen, the browser will start rendering the full content on the screen. The faster the rendering process, the quicker the content loads. If the server responds quickly, the content will also display soon. Therefore, FCP depends on both the Time to first byte (TTFB) and the content loading time on the browser
so we can write it as FCP =TTFB + Content rendering time
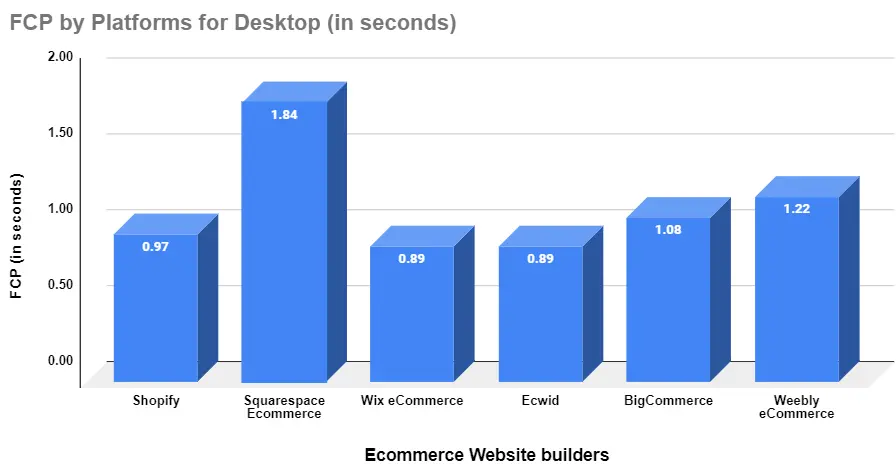
Desktop vs Mobile
Desktop:
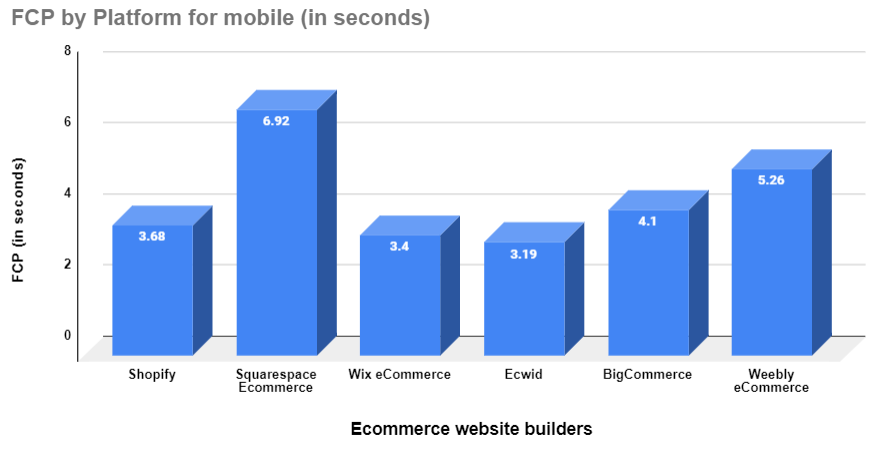
Mobile:
Google has defined FCP as a time to load texts, images, SVG elements, and non-white canvas elements. The first contentful paint will display after JavaScript files have loaded on the browser. If a website’s software contains more JS (JavaScript) files, it will take more time to load, and as a result, the first content will be delayed on the screen. This delay can increase the bounce rate of the website. However recent HTTP 2.0 can handle multiple scripts in a single time and asynchronous js load will help to decrease the FCP time. The latest optimized platform’s websites will load faster even they included lots of JS files. (JavaScript helps to bring more modern functionalities.)
Key Points
- Squarespace eCommerce websites take longer to display the first visible content on both desktop and mobile devices.
- Ecwid has fewer JavaScript files so it can display content faster on devices.
- Wix editor is completely built on JavaScript and it is used highest JS for user-friendly features, but surprisingly Wix eCommerce shows higher performance than we expected.
- Squarespace eCommerce loads 10-12 more javascript files than Ecwid before displaying the first contentful paint.
- Removing unused scripts/apps and minifying them can speed up content loading.
Bounce Rate
(FCP time is directly proportional to Bounce rate)
Bounce Rate is a percentage metric that indicates the number of visitors who leave a website without performing any kind of action on the website. This is a very important metric considered in the conversion as well as the SEO process. The most common reason for a high bounce rate is slow page speed. If a page takes too much time to load, then the user is most likely to leave the website and visit another one, which leads to a bad user experience and also lowers the website’s search engine ranking.
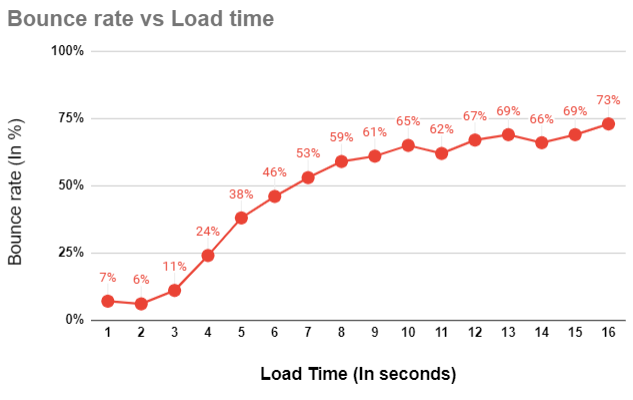
As the loading time increased the bounce rate keeps on increasing as shown in the above graph. If the page FCP is 6 seconds, then nearly 50% of the users will go back.
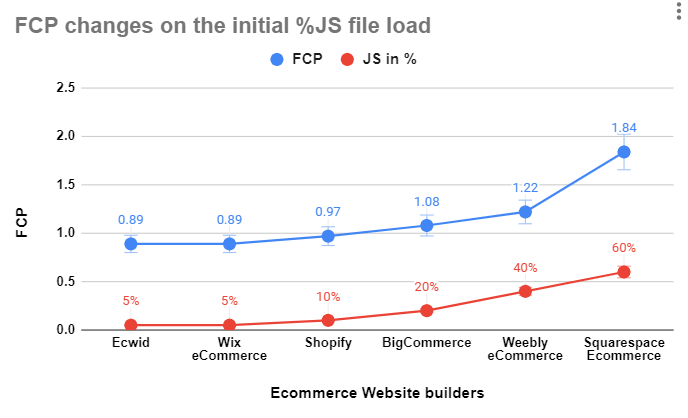
Based on the website data, we found that the website builders which load most of their JS files immediately after the first byte tend to delay the First contentful paint(FCP) on the browser screen. As shown in the graph above, Squarespace loads approximately 60-65% of the JS files before FCP which takes approximately 1.8 seconds to display the first content. on the other hand, Ecwid and Wix eCommerce load only around 5% of their total JavaScript files, resulting in First contentful paint (FCP) of less than 1 second.
This method is good for making a good user experience since users perceive as the website loads too quickly even though the page is not interactive. By the time user take the decision to interact with the website (For example, by clicking the button, or commenting ) the website already become interactive as asynchronous JS files load completely. Hower in rare cases the website should be interactive as soon as it appears. In that case, the JavaScript files should load in the initial stage, making the website more interactive quickly.
#3. Speed Index
The speed index is a performance metric that indicates how quickly the content is populating the screen. The faster the content loads, the better the user experience. If a website has a lot of content, it should load quickly and become fully interactive on the screen. If the speed index takes a long time to load the content, the user may exit the site without taking any action.
Google’s metrics for the Speed index are as follows
| Speed Index (in seconds) | Color-coding |
|---|---|
| 0–3.4 | Green (fast) |
| 3.4–5.8 | Orange (moderate) |
| Over 5.8 | Red (slow) |
If your website’s Speed index is more than 5.8 seconds, it will affect your SEO. If you choose the fastest speed index platform, then most likely your website speed index will be faster.
TTI – Time to Interactive
User Interaction is one of the key metrics assessing user experience on the website. Once the website loads, it should be interactive so that customers can perform actions on the site. Google’s SEO algorithm considers user interaction to be a key metric for ranking websites at the top f search results. Faster website interaction can keep customers engaged and reduce the bounce rate.
Desktop vs Mobile
Desktop:
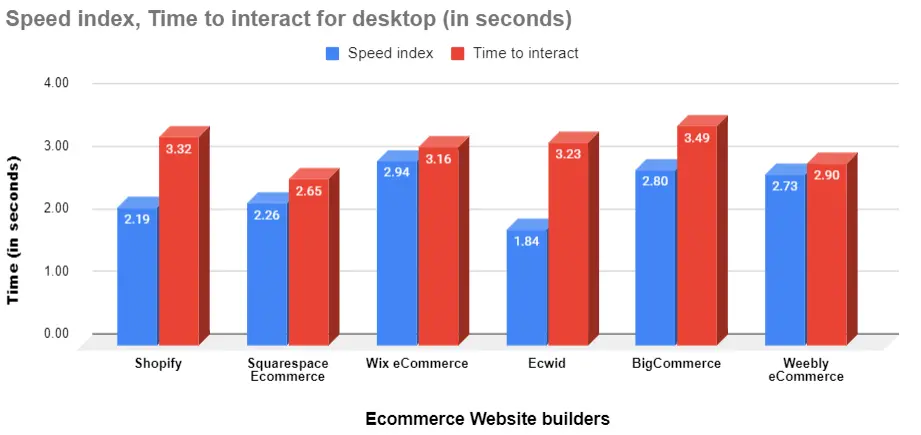
Mobile:
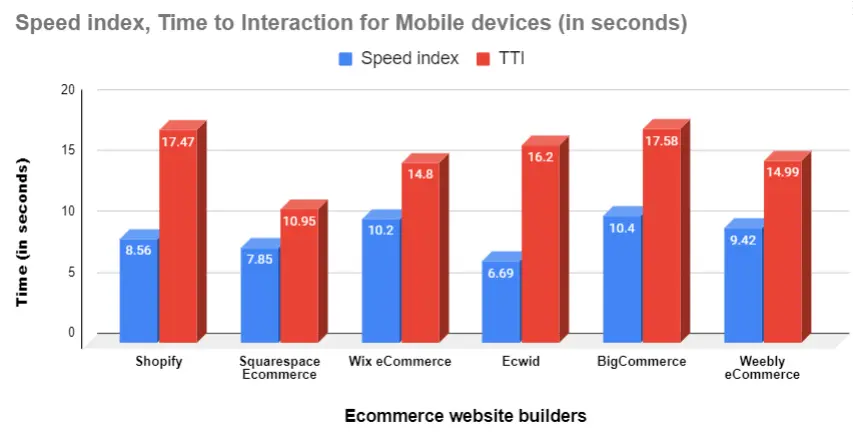
Key Points
- Squarespace e-commerce sites typically become interactive in less than a half-second after the first content appears
- Squarespace e-commerce sites, even larger ones, have similar Speedindex and TTI.
- Mobile devices may take a longer amount of time to become interactive for users.
- Small websites (<1MB) usually become interactive more quickly.
Google’s metric for Time to interact is as follows
| TTI metric (in seconds) | Color-coding |
|---|---|
| 0–3.8 | Green (fast) |
| 3.9–7.3 | Orange (moderate) |
| Over 7.3 | Red (slow) |
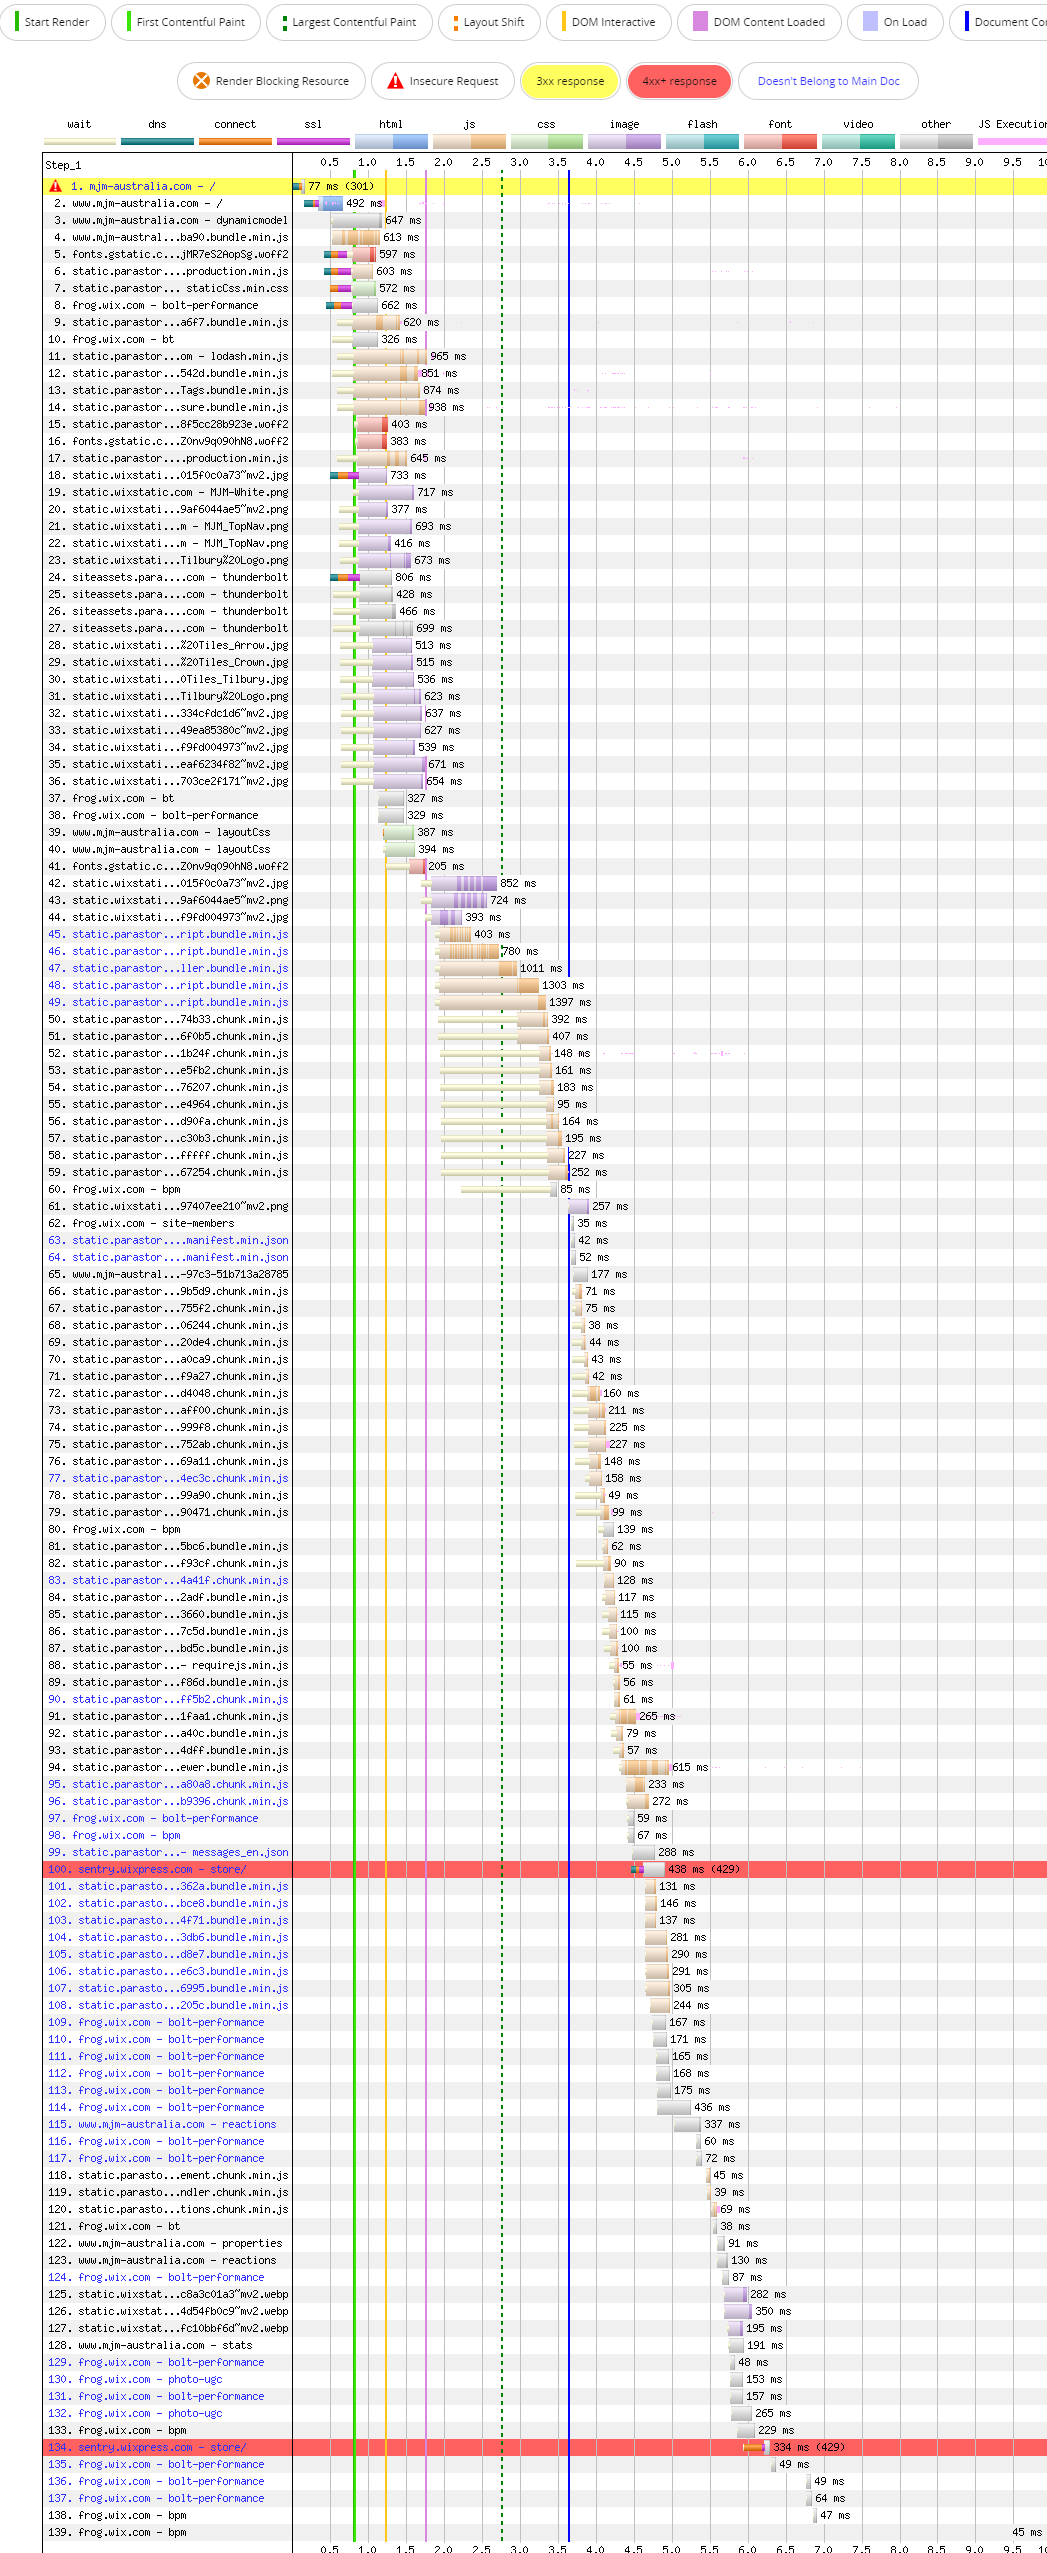
Example Webpage Test
We tested a website to demonstrate the process of how content is displayed until it becomes interactive for users. This website took less than one second to display the first byte of information on the browser. In the below example, the first 1% of content displays a small button and a menu design, which indicates that the first content is loading. Then the website starts indexing all content and image files on the screen in less than 2 seconds, as shown in the image which takes around a second. Once the website is completely loaded, it becomes fully interactive.
Example website
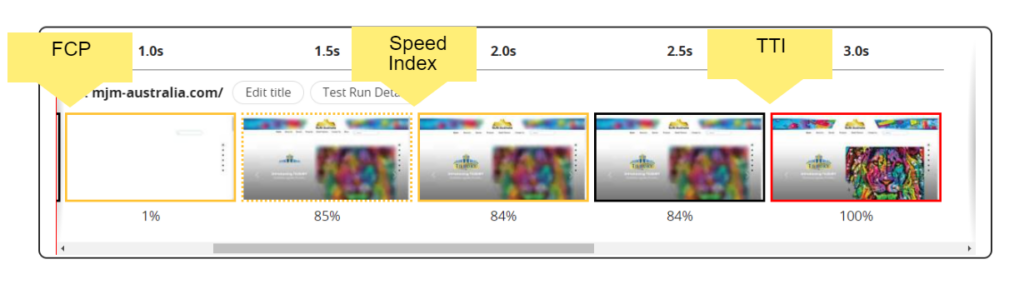
This is an example Wix website where we can see that only one or two JS files are loaded before the green line (which represents FCP). However, as we scroll down the page, more JS files will be loaded. which means that Wix websites may take some time to become fully interactive, even though they can display the first content in less than a second.
Conclusion
Speed is crucial in the fast-moving world. If the world is moving fast, your website should too!
Modern shopping websites utilize numerous automation, tools to manage inventory & high-quality images. With the advent of technologies like 3D images and High-Quality Quick Hover Zoom & possibility of Metaverse shops! So website resources are expanding faster than the Internet speed upgrades like 3G, 4G, and 5G!! Therefore, website optimization for speed is crucial, as a slow website may persist even with 5G Connectivity. This means speed is not just relevant but the most important factor in eCommerce sales & revenues even in the future with 6G, and 7Gs.
Website Speed can be influenced by 100s of factors, but approximately 80% of speed is determined by three primary factors. The quality of the hosting server, The quality of the Website code, and the location of CDNs (Of course, everything is tied to your cable or mobile internet speed). If any of these three factors are lacking, the website will likely load slowly.
Our Recommendation
If you choose an eCommerce platform randomly and its server codes or CDN are not good, your website may go down frequently, load slowly during traffic spikes, or be unable to handle high traffic. You may lose many potential customers, sales, or fans simply because of the slow website performance. Website speed can fluctuate depending on the time & the server load, so it can be difficult to notice when your website slowed down during times of high traffic. However, you can easily track website speed using speed monitoring services.
Instead of trying to do too and being overwhelmed, it is better to choose a fast eCommerce platform to build your website. The speed of your website can have a significant impact on your revenue both in the short term and the long term. A slow website can frustrate visitors and also insist they leave, making it more difficult for them to find for the product they are looking.
Today more than 95% of all the eCommerce websites in the world are built using popular eCommerce platforms such as Shopify, Wix Stores & CMS like WordPress. The faster a website loads, the higher the potential for increased sales, a better Google ranking, and improved user experience & performance.
Website speed is crucial as it is one of the main factors of user experience. Google ranks those sites that provide better user interactions. A site with good content should be interactive to engage customers with their business. following are the stats on why speed is important to a website.
Jack is the Co-founder of WebsitebuilderLy, a Software Engineer from Standford University, An entrepreneur with 12 years of Website Creation, Management, Marketing Automation & App Development Experience. Worked for the world’s leading companies such as Roblox, HTC, etc.


Your tests are not conclusive.
All other platforms load extremely slow when you navigate from one page to the next.
ECWID is almost instant because it is single-page application
That means once the page is loaded the whole experience is much much faster, unlike Shopify, Squarespace, BigCommerce, WooCommerce etc.
Can you please check our test again properly?!
Because what you are saying is the same thing we are also telling!, lol
Yes, See the comparison table in this post where you can see that Ecwid’s many metrics are the fastest among all platforms.
According to our research and what this post is saying Ecwid websites are loading faster, But….
As I quoted in the post “Ecwid has fewer JavaScript files so it can display content faster on devices.” it gives fewer functionalities, so it will load fast, but it doesn’t mean Ecwid server quality is better than Shopify.
Since Ecwid is free & the starter plan is the cheapest, I think most Ecwid customers are not serious and they just put some products with plain pages. If you do the same thing on Shopify, then it will load as fast as Ecwid. We took a sample of websites, Some platform community has different demographic with different taste and goals. Shopify platform managed to load fast even though its website has a lot of scripts since it has a lot of apps.
Since we researched all metrics including functionalities in sacrificing with speed ratio and the holistic approach, we found something new that most people don’t notice!